First version of article was published 7 years ago on Russian language and 5 years ago on English (with some modifications). Hyper-V is tremendously expanded since. Some time ago, I spend during Hyper-V memory investigation, now I am trying to see, what change in the world since 1st version of article was published, and what tools other researchers are using now.
Early Hyper-V was available only for Windows Server or Hyper-V Server (limited version of Windows Server) operations system family. But now many Windows components, including desktop, are based on Hyper-V.

Therefore, I decided to write actual version of that article. Some of techniques are outdated, many new tools were developed since, and it is interesting, how we can debug Hyper-V using this tools. Article will be described Hyper-V kernel mode debugging.
When 1st edition of article was written, only VMware Workstation supported nested virtualization. Now nested virtualization is default standard of emulation software, and it is supported by VMware, Hyper-V (Intel only, AMD still beta and available from Windows 10, build 19636 - https://techcommunity.microsoft.com/t5/virtualization/amd-nested-virtualization-support/ba-p/1434841), VirtualBox, Qemu.
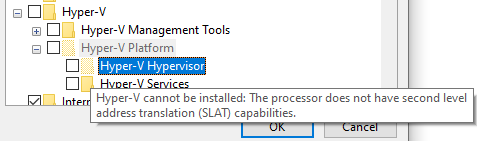
VirtualBox 6.1.16 doesn’t support SLAT on Intel CPU, therefore can’t be Hyper-V debugging environment now.
Microsoft is developing Hyper-V for Linux host. Only some patches were published for Linux - https://lwn.net/Articles/838146/. It will be interesting to see it in working environment in future.
1. Terms and definitions
− The hypervisor (hypervisor module)– component of Hyper-V, depending on the manufacturer of the processor (hvix64.exe for Intel and hvax64.exe for AMD, hvaa64.exe for ARM). The article discusses Hyper-V for Intel family processor.
− Hypercall – call a given function in the hypervisor using the instructions vmcall\vmmcall\hvc.
− Root-partition – Windows Server 2019\Windows 10 with enabled Hyper-V partition.
− VMCS (virtual-machine control structure) – structure, that defines logic of the hypervisor.
− VMX root – mode, in which hypervisor is running.
− VMX non-root – mode, in which the running operating system and its client application software.
− VM exit – the transition of the VMX non-root into VMX root. Occurs when the execution of instructions or conditions specified in the VMCS incorporated directly into the logic of the processor.
2. Debugging
2.1. Com-port debugging
Hyper-V consists of several components; a brief description can be found in https://docs.microsoft.com/en-us/virtualization/hyper-v-on-windows/reference/hyper-v-architecture. For debugging Hyper-V components you can use WinDBG or other usermode or kernelmode debugger, however, to connect to the hypervisor you have to perform a few extra steps to configure root-partition.
For debugging hypervisor, Microsoft developed a special extension to WinDBG hvexts.dll, which, unfortunately, is not included in the distribution debugger and is available only to partners (because that extension needs private symbols for hypervisor module, which is not present). Also, in the catalog winxp, located in WinDBG folder, is an extension of nvkd.dll, which is intended for debugging extensions virtual switch Hyper-V.
WinDBG help file contains description of debugging hypervisor via cable through the com-port (search - Debugging Hyper-V via a Null-modem Cable Connection in debugger.chm), implying the presence of two physical machines. However, the hypervisor can be debugged, if you run it in any supported virtualization software. Next, we see VMware Workstation. Install Windows Server 2019 as guest OS, enable Hyper-V component.
If you directly connect to VMware com-port, you get some errors during communication. Use some free com-port utility for connection stabilization (I used com-port emulator Free Virtual Serial Ports utility from the HHD-software (https://freevirtualserialports.com) – version 3.32. Version 4.12 give errors, when vmdemux is tried to open COM-port)
Actions:
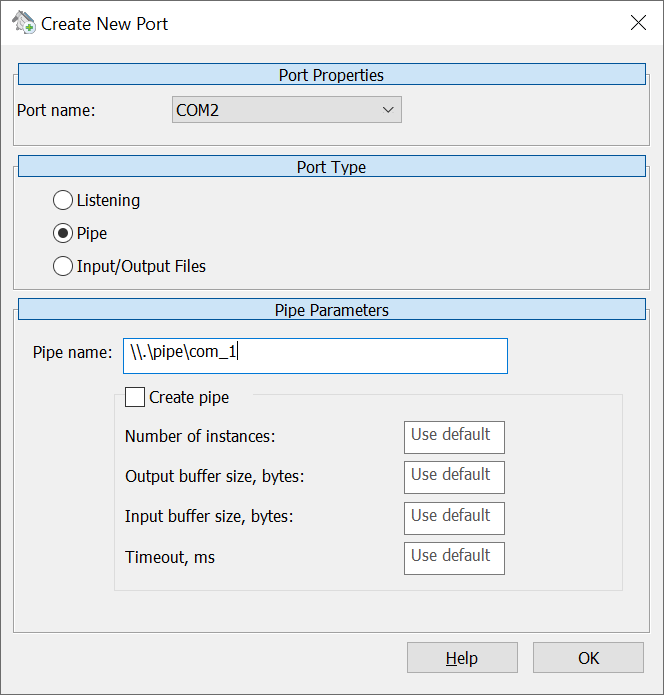
1. Create com-port for VMware virtual machine (Hardware->Add->Serial port->Use named pipe). Enter \\.\pipe\com_1

2. To perform root-partition commands to configure debugging hypervisor and the OS:
Hypervisor debugging options
bcdedit /hypervisorsettings serial DEBUGPORT:1 BAUDRATE:115200
bcdedit /set hypervisordebug on
root OS debugging mode (using same com-port)
bcdedit /set dbgtransport kdhvcom.dll
bcdedit /dbgsettings serial DEBUGPORT:1 BAUDRATE:115200
bcdedit /debug on
Additionally
Bcdedit /set bootdebug on (needed to study process of hypervisor loading in next part of the article)
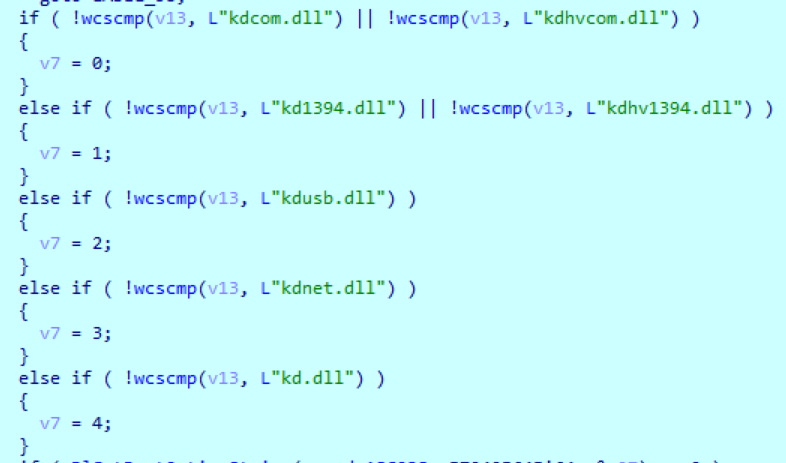
Standard debugging extensions is:
Kdcom.dll
Kdhvcom.dll
Kd1934.dll
Kdhv1394.dll
Kdusb.dll
Kdnet.dll (with many of network card’s vendor modules)
Kd.dll
We use kdhvcom.dll in our case.
3. Restart Windows Server 2019. OS will stop in waiting for debugger connection.
4. Open HHD software Free Virtual Serial Ports, select File, then Create Pipe Port. In the field of Pipe name specify the same value for a virtual machine - \\.\pipe\com_1. Create pipe option must be empty (for listening pipe, not creation)
Press OK.
Do this after VM will be launched, or you can see error, that pipe is not presented (VMware creates it, if VM was launched)

5. Run vmdemux (located in WinDBG x64 directory), specifying the name of the port as one of the parameters:
vmdemux.exe -src com:port=com2,baud=115200
Command creates two named pipes: Vm0 for hypervisor and Vm1 for root-partition

6. You can attach WinDBG Preview to every pipe for testing:
WinDBGx.exe -k com:port=\\.\pipe\Vm1,pipe,reconnect,resets=0 – root partition

WinDBGx.exe -k com:port=\\.\pipe\Vm0,pipe,reconnect,resets=0 – hypervisor

7. After that, using IDA PRO, you can connect directly to the hypervisor through named pipe \\.\Pipe\Vm0, choosing WinDBG debugger and specifying process options in the connection string: com:port=\\.\pipe\Vm0,pipe,resets=0
8. If following message appears, choose Same.

9. The debugger will stop within hypervisor:

10. As we see in comparing with Windows Server 2012 (R2) there is new module – kdstub.dll. Early versions of hypervisor have static link with debug library and large file size (2-3Mb), size of current version of hvix64.exe (10.0.17763.1577) – 1 230 KB.
For network debugging kdstub.dll will be changed on appropriate debug module, f.e. kd_02_8086.dll:

How configure COM-debugging Hyper-V inside Hyper-V VM you can read at article, written by Saar Amar (@AmarSaar):
https://msrc-blog.microsoft.com/2018/12/10/first-steps-in-hyper-v-research/
2.2. Network debugging
There is opportunity to debug hypervisor over network in Windows Server 2012 and higher:
Enabling debugging and specify port (different for root and hypervisor)
Bcdedit /debug yes
Bcdedit /dbgsettings net hostip:192.168.2.1 port:50002
in response, the command will display the connection string of the root-partition
bcdedit /set hypervisordebug on
bcdedit /hypervisorsettings NET HOSTIP:192.168.2.1 PORT:50000
in response, the command will display the connection string of the hypervisor.
Choose Host Only for VMware VM network adapter option, go to Edit->Virtual Network Editor of VMware Workstation and see, that DHCP is configure for Host Only subnet. Then, make sure, that guest OS network interface is normally assigned to this address, running command ipconfig /renew inside guest.
Option bcdedit /dbgsettings nodhcp allows the debugger to use network mode, use ip-address of operation system. In this case, DHCP configuring in VMware is not necessary.
Then run 2 instances of IDA PRO, set debugger – WinDBG (x64), the debug type to Kernel Mode and specify the Process Option->Connection string to the following line from the command above:
net:port=50002,Key=1.2.3.4 – root partition
net:port=50000,Key=5.6.7.8 – hypervisor
It gives ability to simultaneously debug root-partition and the hypervisor. Network debugging is simpler for configuring and gives more speed, I recommend use it.
You can use kdnet.exe, which was included in Debugging Tools for Windows 10, for configuring root-partition for debugging:
kdnet.exe 192.168.2.1 50002
You can see message “Microsoft hypervisor supports using KDNET in guest VMs”.

For checking this feature kdnet.exe:
1. Detecting the presence of a Hypervisor – cpuid(1), ecx[31] must be equivalent 1.
2. Check Hypervisor Vendor ID Signature – cpuid (0x40000000) must return “Microsoft Hv” in ebx,ecx,edx registers.
3. Check Hypervisor Interface Signature – cpuid(0x40000001), eax must contains Hv#1 (HviIsHypervisorMicrosoftCompatible) or Xbnv (HviIsAnyHypervisorPresent).
4. Check Build Number – cpuid(0x40000002), it must be equivalent or above 0x23F0. If it below caption appears:
The Microsoft hypervisor running this VM does not support KDNET. Please upgrade to the hypervisor shipped in Windows 8, Windows Server 2012 or later.
5. Execute cpuid (0x40000003) and check that ebx[12] must be 1 (it means that partition was created with CpuManagement flag)
6. Finally execute cpuid (0x40000004) – implementation recommendation. Check nested virtualization (bit 12), if presented, return true.
If all checks was passed kdnet prints message about KDNET supporting.
If you configure guest virtual machine, kdnet.exe prints additional message:
Kdnet.exe 10.0.0.1 50020
Enabling network debugging on Intel(R) 82574L Gigabit Network Connection.
Manage-bde.exe not present. Bitlocker presumed disabled.
To debug this machine, run the following command on your debugger host machine.
windbg -k net:port=50020,key=3p62jxxhmzlc1.3ygror9z6lgy.oq0wi18racbo.1fe0y66p7uzqe
Then reboot this machine by running shutdown -r -t 0 from this command prompt.
KDNET.exe read vmguid from HKLM\Software\Microsoft\Virtual Machine\Guest\Parameters\VirtualMachineId key and debugging key from HKLM\BCD00000000\Objects\{4636856e-540f-4170-a130-a84776f4c654}\Elements\1200001d\Element

What WinDBG commands can be executed inside Hyper-V debugging session? Hyper-V kernel module doesn’t have symbols, therefore hvexts.dll extension is not accessible. But we can execute some standard WinDBG commands even without symbols. If some commands are not working, simply reload extensions:
.load kext
.load kdexts
.load exts
.load ext
- lm – view modules
- k* - view stack
- d*, e* - read\write data from virtual addresses
- !d*, !e* - read\write display data from physical addresses
- r – display registers
- !vtop – translate virtual to physical addresses. First, get cr3 and paste it as first parameter. Va is second
2: kd> !vtop 0x10839d000 0xfffffbb3aa6c3e66
Amd64VtoP: Virt fffffbb3aa6c3e66, pagedir 000000010839d000
Amd64VtoP: PML4E 000000010839dfb8
Amd64VtoP: PDPE 000000010a603670
Amd64VtoP: PDE 000000010a604a98
Amd64VtoP: Large page mapped phys 00000001000c3e66
Virtual address fffffbb3aa6c3e66 translates to physical address 1000c3e66.
- !pte2va
- !ptov <cr3>
- dx extenstion is available too, but with some limitation (because of no symbols):
@$debuggerRootNamespace.Debugger.State.PseudoRegisters.General. Exentry pseudo-register shows hvix64.exe entry point.
2.3. Debugging using embedded vmwp.exe capabilities
Debugging guest Hyper-V VM can be made using debugging capabilities of the worker management process (vmwp.exe), which was mentioned by Jake Oshins on OSR Online (https://community.osr.com/discussion/234398) and Rafael Rivera (@WithinRafael) in his blog:
I updated Jake Oshins’s script and uploaded it to github.com:
https://github.com/gerhart01/Hyper-V-scripts/blob/master/hyperv-dbg-2019.ps1
Windows 10 and Windows Server 2019 doesn’t need additional files for it working. Script can configure guest VM, using powershell direct feature.
1. shutdown guest OS.
2. set parameters for hyperv-dbg-2019.ps1 script

3. run the script (run through the „Run as Administrator“, or disable UAC, run gpedit.msc and set Computer configuration \ Windows Settings \ Security Settings \ Local Policies \ Security Options \ User Account Control: Run All administrators in Admin Approval Mode to Disable) in the root-section
4. start WinDBG:
WinDBG -k net:port=50010,target=127.0.0.1,key=1.2.3.4
5. execute the command break (Ctrl+break), then the debugger will stop inside the guest OS. You can inspect VM, using standard WinDBG commands, but intensive debugging may cause hangs of guest VM.
2.4. Debugging using VMware GDB stub
VMware Workstation supports embedded GDB debugger. For enable it add next lines in vmx-file of VM:
debugStub.listen.guest64 = "TRUE"
debugStub.listen.guest64.remote = "TRUE" – for remote debugging
debugStub.hideBreakpoints = "TRUE"
monitor.debugOnStartGuest64 = "TRUE" – stop on BIOS loading
Then you can attach IDA PRO, Ghidra or radare2 to GDB stub.
See GDB debugging example in part 3 of article (debugging hypervisor).
2.5. Debugging Windows 10X emulator
Windows 10X emulator is Hyper-V based. Emulator OS is running as Hyper-V VM, Windows 10X – is nested VM.
Alex Ionescu (@aionescu) and @WithinRafael showed interesting methods for getting debugging settings:
https://twitter.com/aionescu/status/1237639135088611329
https://twitter.com/WithinRafael/status/1237813722803924992
You can mount flash.vhdx (2 clicks on file) from emulator, which is placed in
C:\ProgramFiles\WindowsApps\Microsoft.Windows10XEmulatorImage10.0.19578.0Previ_1.0.1.0_x64__8wekyb3d8bbwe\Content (copy it in another place, if you get some errors with access rights). Name of catalog can contains another build number in future.
Before mount:
After mount:

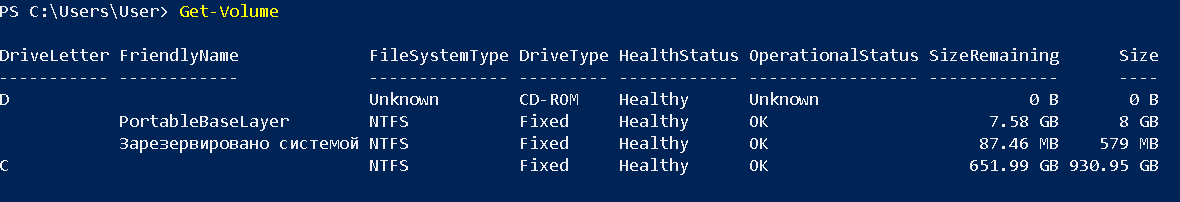
select volume with VIRT_EFIESP label:
Get-Volume | ? {$_.FileSystemLabel -eq "VIRT_EFIESP"} | Format-List
mountvol Z: \\?\Volume{12aef83a-6cf2-4ea1-932f-b3a586a65308}\
bcdedit /store "Z:\efi\Microsoft\boot\BCD" /dbgsettings
you can get all settings of boot records of root emulator partition, using command:
bcdedit /enum all /v /store "Z:\efi\Microsoft\boot\BCD"
We also can see testsigning on option.
For getting guest OS debugging option you need guest OS kernel dump:
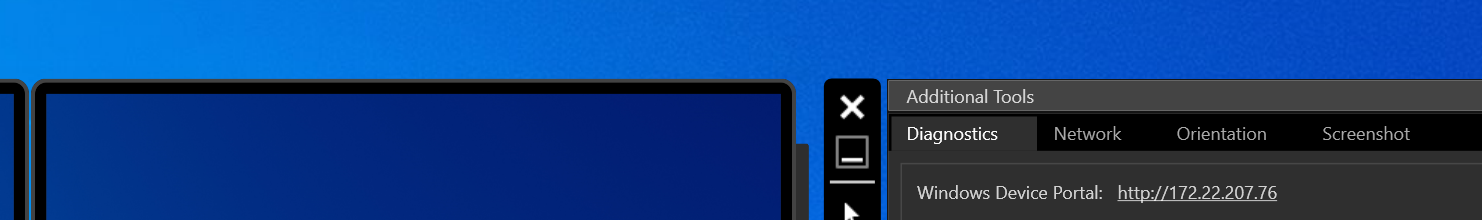
Go to Windows device portal – Debug. Download live kernel dump and open it in WinDBG

And run decypher_kdnet_key.py script. Script found kdnet parameters from offset and cyphered it to base36 format
Finally, we get current kdnet debugging settings:

Next, launch WinDBG, using string:
windbgx.exe -k net:port=50005,key=2k85xmoorkrbx.u7xg1f35gwi4.24033ib08wzhs.2o8xly2z2ik5y
you attached to Host OS:

2.6. Debugging Hyper-V on physical host
There are researches from @d_olex and @_xeroxz. They replace some boot files and intercept Hyper-V loader processes.
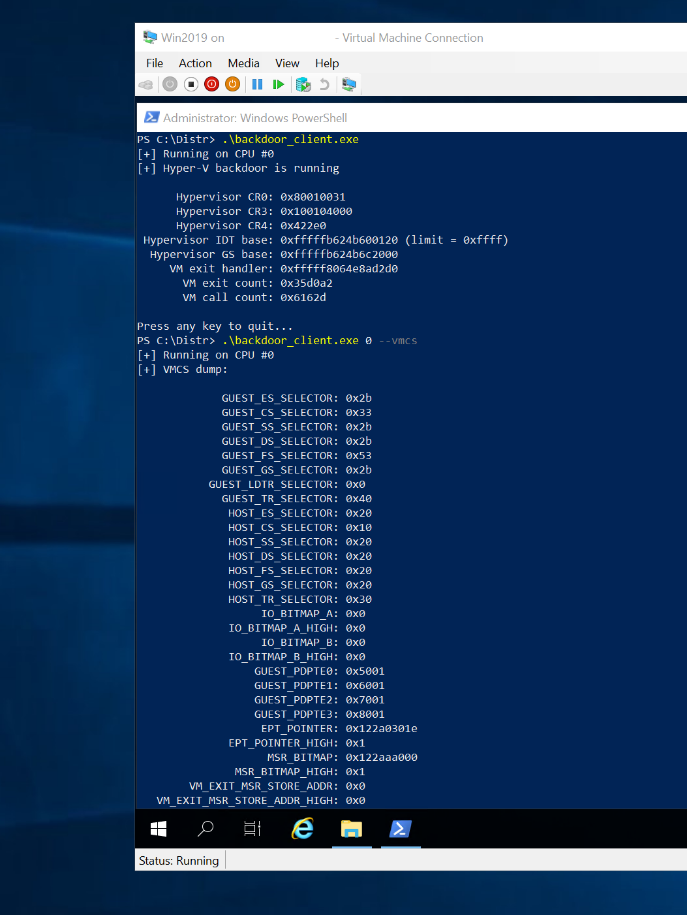
Download latest build from https://github.com/Cr4sh/s6_pcie_microblaze/tree/master/python/payloads/DmaBackdoorHv, and simply run bootkit_installer.ps1 in host OS (tested on Windows Server 2019 inside VMware Workstation).

reboot Host OS and see:

In guest OS we can run backdoor_client.exe and see many of Hyper-V internals information:
Current commands are supporting:
--debug
--virt-read
--virt-translate
--phys-read
--phys-translate
--idt
--vmcs
--ept-list
--ept-dump
--sk-info
--sk-ps
--sk-debug-enable
--sk-inject
--vm-inject
--vm-exec
You can download Voyager from https://githacks.org/_xeroxz/voyager. It doesn’t contain binaries (at article write time), and you need compile it first for special platform and run launch.bat. After rebooting you see:

You can run example.exe inside guest VM:
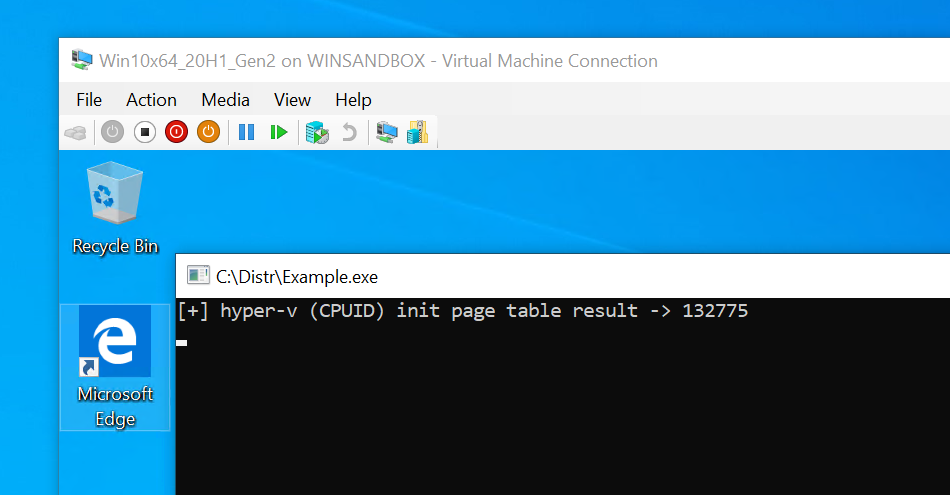
Probably, we see more examples in future.
2.7. Securekernel debugging
LiveCloudKd EXDi module can be used for debugging Hyper-V guest OS without enable kernel debugging in bootloader. Instructions available on module page:
https://github.com/gerhart01/LiveCloudKd/blob/master/ExdiKdSample/LiveDebugging.md
Another method was described by @commial:
https://github.com/commial/experiments/tree/master/debugging-secure-kernel
2.8. Hyper-V container debugging
LiveCloudKd EXDi plugin can be used too, but it is better to switch Hyper-V scheduler to classic:
bcdedit /set hypervisorschedulertype classic
debugging instructions can be seen
https://github.com/gerhart01/LiveCloudKd/blob/master/ExdiKdSample/LiveDebugging.md
2.9. Radare2 debugging
Radare2 is interesting debugging console-style platform. You can download latest binaries from https://github.com/radareorg/radare2/releases
but for getting additional information about Hyper-V you need recompile it (it is easy). Compilation instruction are
https://radare.gitbooks.io/radare2book/content/first_steps/windows_compilation.html
Использование radare2 и WinDBG:
https://radare.gitbooks.io/radare2book/content/debugger/windbg.html
https://book.rada.re/debugger/windbg.html
There are good instructions. Before running don’t forget set _NT_DEBUGGER_EXTENSION_PATH to WinDBG x64 dir and copy extensions to radare2 bin folder:
ext.dll
exts.dll
kdexts.dll
kext.dll
radare2 commands for testing:
pd – disassemble
xq @0x<address> - display memory content
v – switch to GUI mode
There are two radare2 mode for connection to Windows kernel debugging: dbgeng.dll interface and own winkd protocol implementation
2.9.1. Radare2 + WinDBG dbgeng.dll interface
Configure hypervisor in network debugging mode and run radare2 with parameters:
radare2 -d "windbg://-k net:port=50011,key=1.2.3.4"
You can execute WinDBG standard commands using =! prefix.

2.9.2. Radare2 + embedded winkd extension
radare2 -D winkd winkd://192.168.174.1:50011:1.2.3.4
I got error while udp socket opening. Probably, it is some mistake in my lab, but you can try it in your environment.
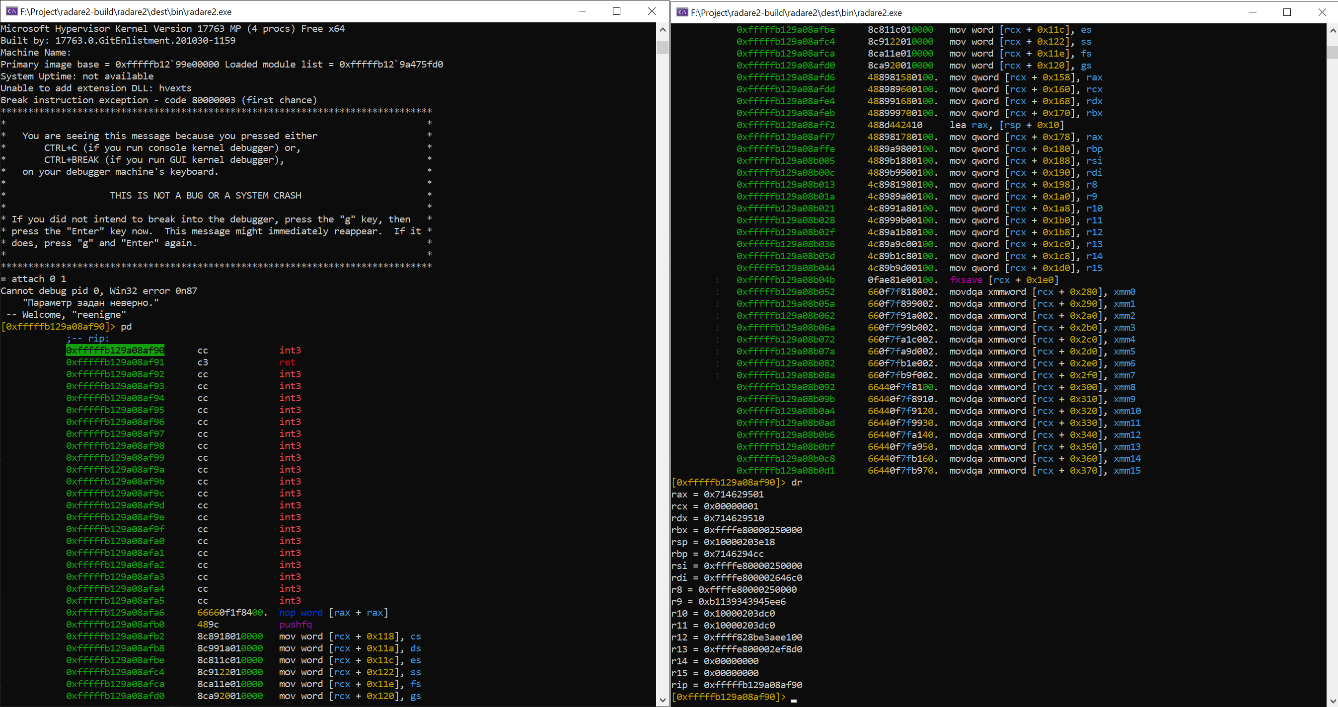
Connect to Hyper-V, using com-debugging through vmdemux pipe:
radare2 -D winkd winkd://\\.\pipe\Vm0
using debugging protocol, you get additional information about Hyper-V:

Kd protocol is changing sometimes. If you get some hangs or error, first try to make connection using standard WinDBG debugger through com-port, next disconnect and attach radare2.
2.9.3. Cutter
Cutter - gui frontend for radare2, having interesting debugging capabilities, but in beta stage. It has integrated Ghidra decompiler, therefore it can be very useful. Cutter support GDB and WinDBG-pipe debugging options now.

While article was written, rizin, fork of radare2, was created. Cutter migrated to that framework.
2.10. Qemu
Qemu is supported nested virtualization. But without accelerator qemu works very slow. Accelerator with nested virtualization is available under Linux platform.
Demo was made on Ubunt 20.04.
1. Install Qemu and Virt-manager:
sudo apt-get install qemu qemu-kvm virt-manager
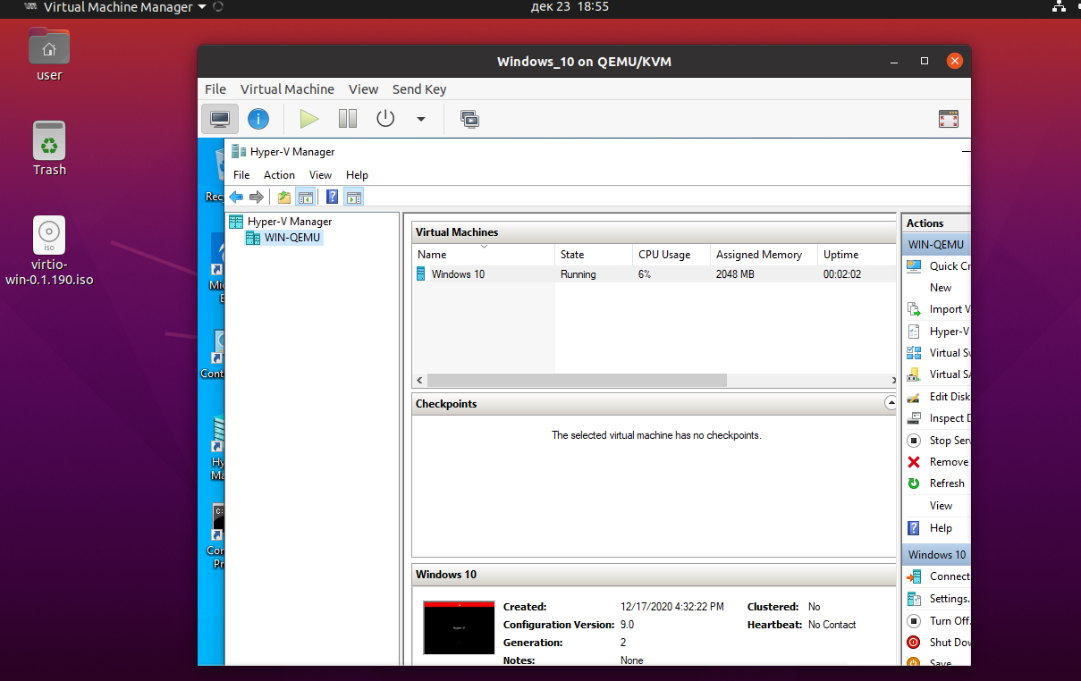
2. run virtual machine manager and create virtual machine with some configuration (2 cpu, 8Gb memory)
3. install Windows 10 as guest. It is better using VirtIO drivers for disk for increasing performance.
4. Install Hyper-V in guest OS and guest OS in Hyper-V. Shutdown VM.
5. Enable gdb debugging for Qemu:
virt-xml <vm_name> --edit --confirm --qemu-commandline='-s'
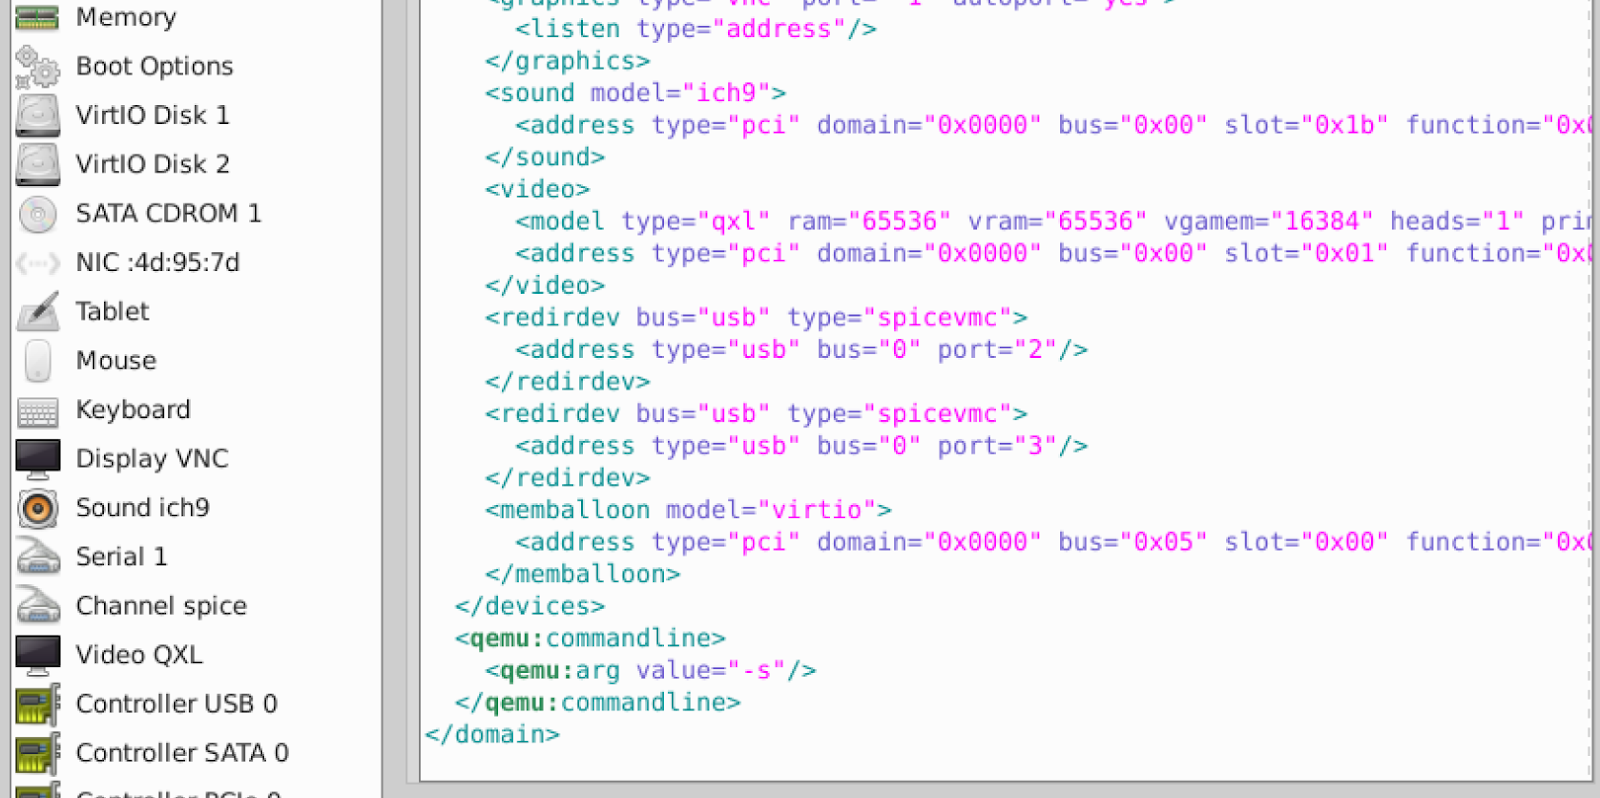
See XML config file in virtual machine manager: you can find additional qemu:commandline option
6. Power on VM
7. Check, that port is enabled (default port is 1234)
netstat -antp | grep 1234
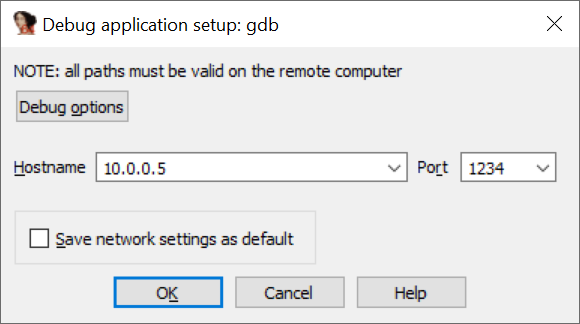
8. Start IDA PRO and select Debugger->Attach->Remote GDB debugger. Set IP-address with Qemu-KVM host and press OK.
9. You will be inside Qemu guest VM (hypervisor, host OS or guest OS)

2.11. Ghidra + retsync plugin
Good Ghidra book is “The Ghidra book. The definitive guide”
You can download compiled build of Ghidra from https://ghidra-sre.org/ and retsync from https://github.com/bootleg/ret-sync.
In my case GHIDRA distr 9.1 version was built over 8 months ago, and I decided to compile it from source.
Update: It’s funny, that I built Ghidra 11.11.2020, and 13.11.2020 NSA upload public 9.2 build to their server. Sometimes it is good, that NSA hacked all computers in the world ))

But I keep short building instructions in article.
Full building instructions you can find at:
https://github.com/NationalSecurityAgency/ghidra/blob/master/DevGuide.md
Compile instruction:
− download Ghidra source from https://github.com/NationalSecurityAgency/ghidra
− download and install Maven, gradle, win flex+bison (2.5.3 version. 3 version gives errors during compiling. Rename files to flex.exe and bison.exe), Visual Studio 2019 + Windows 10 SDK;
− run
gradle --init-script gradle/support/fetchDependencies.gradle init
gradle buildGhidra
− get distributive archive from Ghidra distr directory and unpack them ghidra_9.2_DEV
− download retsync from https://github.com/bootleg/ret-sync
You can use compiled version from ret-sync\ext_ghidra\dist directory or compile it using command (you can see complete compile functions at same page):
cd ext_ghidra
gradle -PGHIDRA_INSTALL_DIR= C:\Github\Ghidra\build\dist\ghidra_9.2_DEV
In my case some error in Decompiler highlighting class was gotten. I simply commented it.
High resolution display can be needed in additional fixes. Add to support\launch.properties string:
VMARGS_WINDOWS=-Dsun.java2d.uiScale=2
Next you need create project for Ghidra.
1. Launch Ghidra using ghidraRun.bat
2. Import retsync plugin: File->Install extension, press green +.
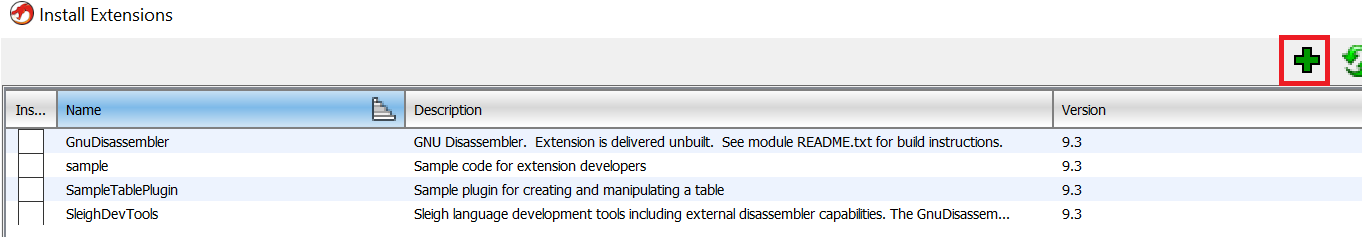
Select zip archive with retsync plugin:
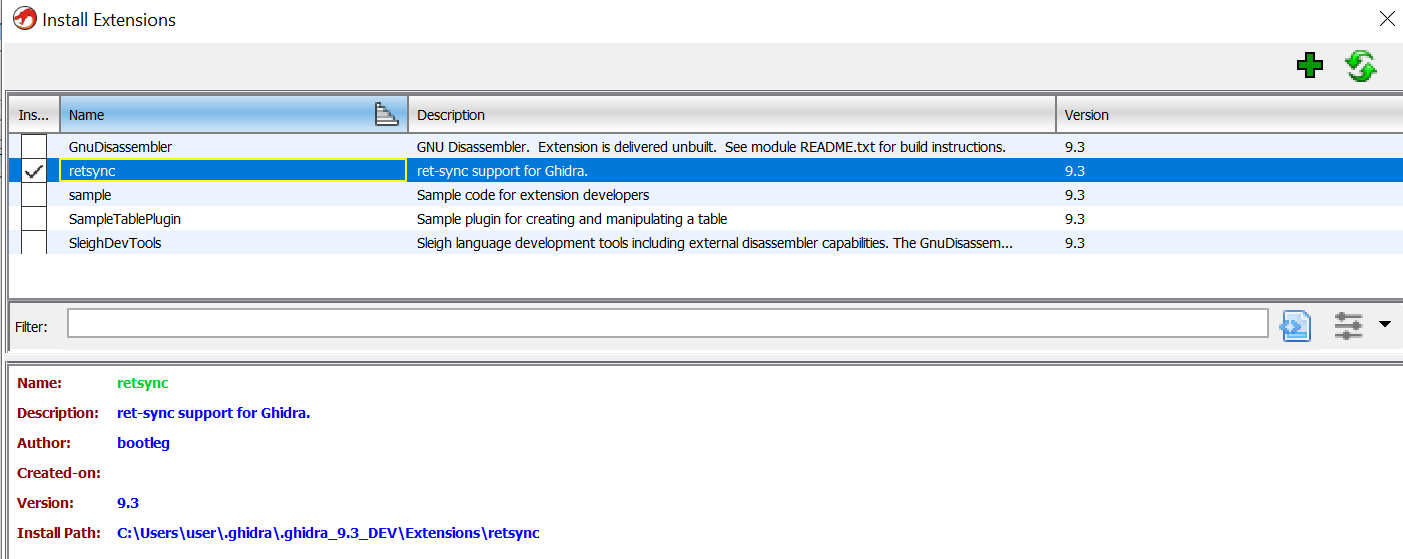
Press Ok, restart Ghidra.
3. File->New project. Non shared project. Set project directory and project name. Folder with project name and gpr-file will be created in project directory (if folder exist, you see message at bottom).

4. Press CodeBrowser icon.

You see message with retsync plugin settings request:
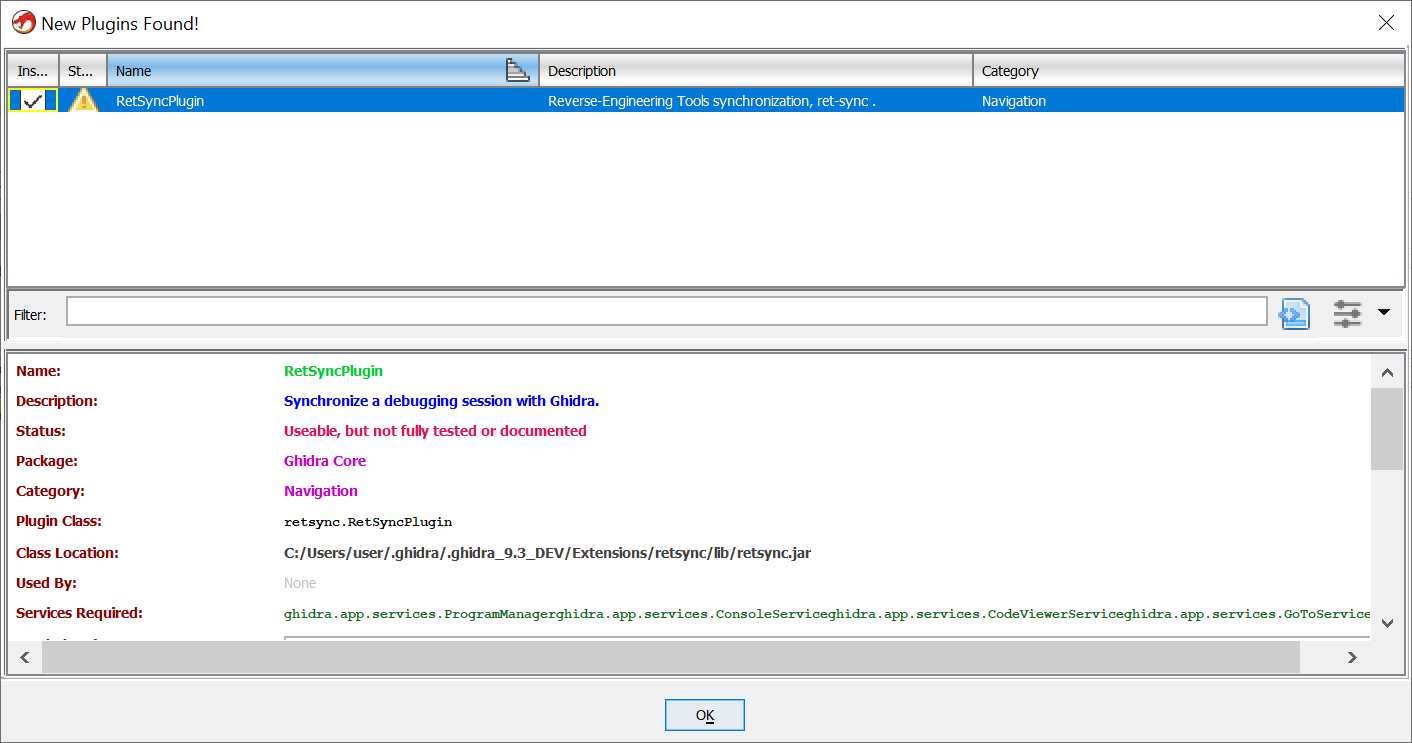
5. Press OK, and you see empty Ghidra project windows. Load hvix64.exe file using File->Import file

6. Press OK. File will be imported. Next you see question about analysis. Press “Yes”

You can try “Aggressive instruction finder” (hypervisor contains much of different code chunks, that can’t be catched during control flow graph analysis)

Press OK
Current progress state you can see at right bottom corner:
7. Next you see message about not-presented hvix64.pdb file. Press Ok – symbols really is not present.
8. Press Alt+S for retsync enabling and you see message (ret-sync enable, server listening, server started)

9. Attach WinDBG to Hyper-V (for example, over network) and load retsync plugin:
.load @”C:\hv_debugging\sync.dll”
!sync
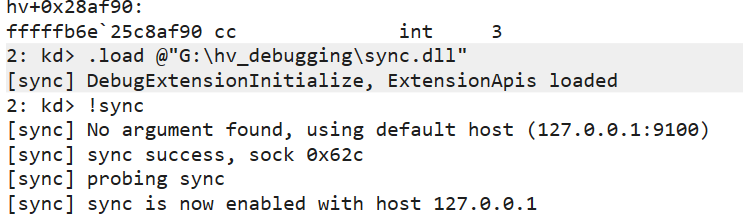
You get messages in Ghidra console window:
In WinDBG you can see simple single step output:
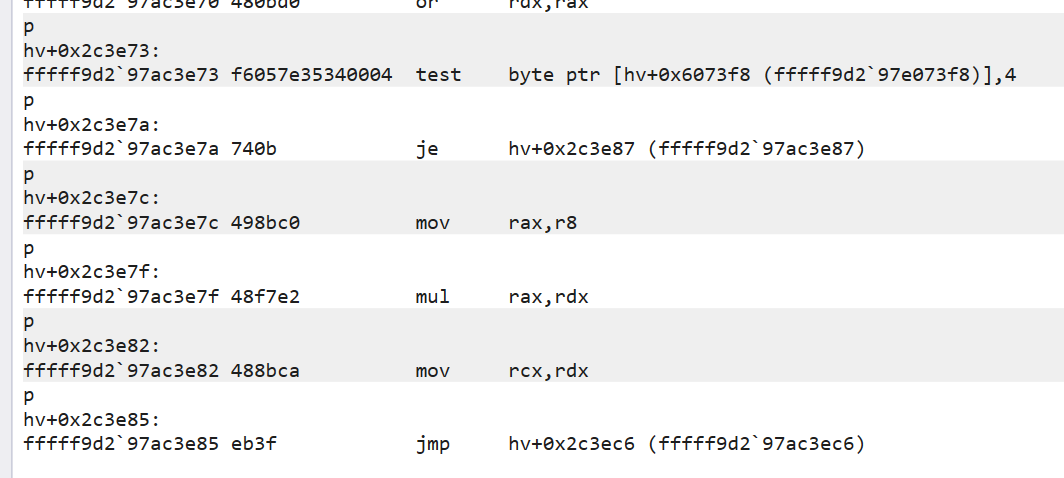
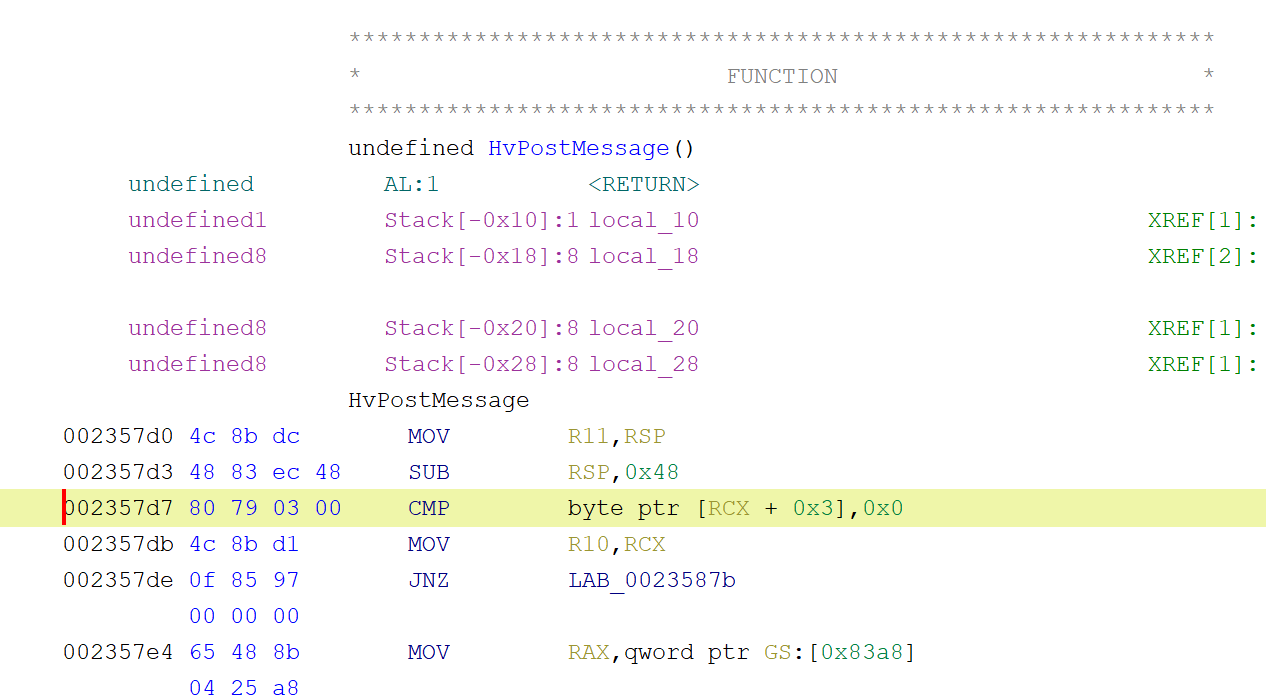
I set breakpoint on HvPostMessage hypercall (F2) and press go (F5), bp was triggered in WinDBG and was synced with Ghidra.
Next made some singlsteps (F10)
retsync shortcuts (from plugin settings):

retsync settings (from radare2 official github.com page)

WinDBG sync plugin:

You can export symbols from IDA PRO using Fake PDB plugin and import it Ghidra database.

Interesting, that Ghidra during analysis could find 4100 functions inside hvix64.exe (build 10.0.17763.1577), IDA PRO found 3687 functions (without manual definitions).
At the time of publication, Ghidra had new “debugging” fork, but kernel mode debugging is not available. It is recommended to see to the developer stage of that fork. Embedded Ghidra debugger must be should be much more convenient.
3. Hypervisor loading
Hypervisor loader component has some changing during Hyper-V evolution:
hvboot.sys - Windows Server 2008, 2008 R2;
hvloader.exe or hvloader.efi - Windows Server 2012 R2,2016;
hvloader.dll - Windows 10, Windows Server 2019.
WinDBG debugging is comfortable enough, but in some stages of hypervisor loading debugging is not accessible (functions, like BlBdStop, disable debugger), therefore we will see hypervisor loading through GDB.
Also we can use this method, when WinDBG is not available (f.e. when OS is loaded with Secure Boot option).
First, we must prepare IDA PRO databases for GDB debugging. We have 3 files:
winload.efi
hvloader.dll
hvix64.exe
hvix64.exe and hvloader.dll doesn’t have symbols.
Firstly, we connect WinDBG (we need to find loading offsets of winload.efi and hvloader.dll). Secondly, we disable WinDBG, enable SecureBoot in host OS and start debug it.
For testing I used Windows Server 2019 (4 CPU. CPU count is not important during boot process, but when you load hypervisor and NT-kernel you will be constantly switched between it – it is critical during single step debugging).
We will debug winload.efi first. IDA PRO shows limited debugger options, when application type is windows boot. Open your favorite PE editor, select “Optional header->Subsystem” and change “Windows boot application” to “Windows GUI”.
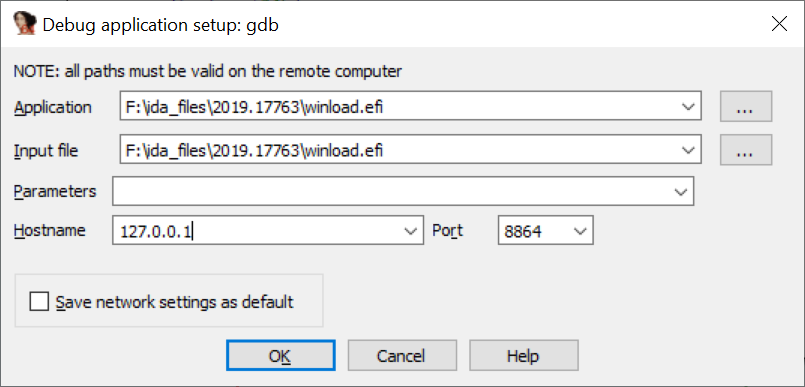
The research used hvloader.dll (10.0.10011.0) and hvix64.exe (10.0.10074.0). Before debugging load winload.exe into IDA PRO, choose Debugger->Select Debugger->GDB, in the Process Options to specify the Hostname 127.0.0.1 and port 8864.
Thanks to the previously installed boot loader option bootdebug on, winload.efi breaks on early boot stage in winload!DebugService2, and using WinDBG we can see image base.
6. run WinDBG:
WinDBG.exe -b -k net:port=50002,key=1.2.3.4
And find address of winload.efi
kd> lm
start end module name
00000000`008c4000 00000000`00aa5000 winload (pdb symbols)
7. We already loaded winload.efi in IDA PRO, now we can choose Debugger->attach to process for attaching to VMware GDB stub, and after stopping, run Edit->Segments->Rebase program, specified in the Image base load address winload.efi (0x008c4000) and save it in IDA PRO. ASLR is not used in that case, so loading address is not changed, when you restart Windows. Winload.efi can be debugged without rebase operation.
− set breakpoint in IDA PRO on winload!OslArchHypervisorSetup and continue debugging (F9).
− also continue debugging in WinDBG (F5).
winload!OslGetHypervisorLaunchType checks, if hypervisorlaunchtype (0x250000f0) was set.


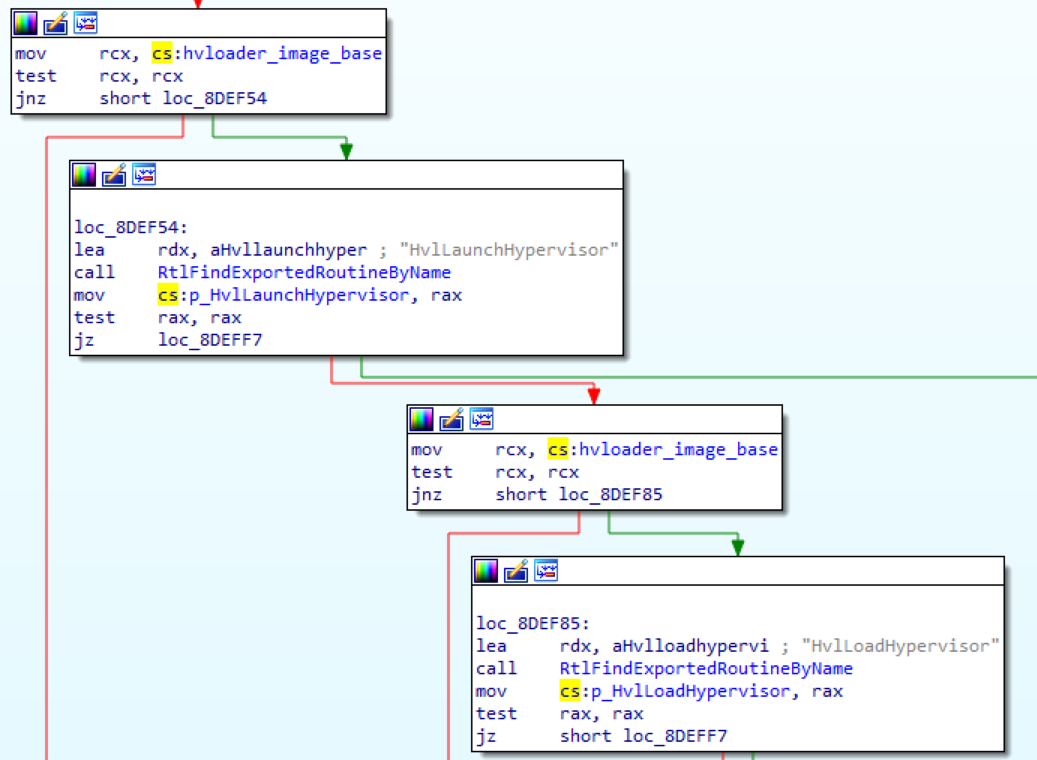
If parameter is specified and its value is 1 (Auto), function try to load hvloader.dll and get addresses of exported functions:
HvlRescindVsm
HvlLaunchHypervisor
HvlLoadHypervisor
HvlRegisterRuntimeRange
HvlUpdateMcUpdateStatus
HvlPreloadHypervisor

Next, go to winload!HvlpLoadHypervisor. After calling CmpFindSkuType, hvloader!HvlLoadHypervisor is called.
Latest hvloader.dll doesn’t contains symbols, but sometimes we need to save explored data to database (IDA PRO works with multiple binaries in one database is not good), therefore we need to switch between databases. Script PatchHvLoader2019.py shows hvloader_image_base (get from early found name) and patch HvlLoadHypervisor with loop cycle bytes (EB FE – jmp rip)
Script is needed in manual definition of hvloader_image_base, p_HvlLoadHypervisor and p_HvlLaunchHypervisor variables. It situated inside winload!HvlpLoadHvLoader function:

Remembered hvloader_image_base address. Close current winload.efi GDB session (or simply make “detach process”) and load hvloader.dll in IDA. Attach to GDB. CPU is still cycled on jmp rip instruction.
Make Edit->segments->rebase program and enter address of hvloader_image_base. Launch RestoreHvLoader2019.py. Now you can debug hvloader.dll.

Now we have fixed winload.efi and hvloader.dll loading addresses (hvloader load address is not randomized in my case).
We can switch off VM, enable SecureBoot option in VM settings (Option->Advanced->UEFI->Enable secure boot) and load winload.efi again.
Set monitor.debugOnStartGuest64 = "TRUE" in vmx config file, start VM, attach winload.efi database to VMware GDB stub and you break immediately, after VM running

Next, press F9 and wait, until you stopped on winload!OslArchHypervisorSetup again.
Winload.efi!BlSiHandleHypervisorLaunchEvent, next winload!OslArchHypercallSetup. End of winload!VlpSetupPhase0. Further bootloader make initialization of disks (including vhd in case of boot-from-vhd option), make UEFI initialization (winload!BlHSTICallProviders), make initialization code integrity policy (winload!OslInitializeCodeIntegrity), winload!OslFwProtectSecConfigVars, winload!OslpProcessEVStore.
Go to winload!VlpSetupPhase1. It calls early found hvloader!p_HvlRescindVsm. Further winload!OslExecuteTransition calls winload!VlpSetupLaunchPhase again, winload!OslArchHypervisorSetup executes in different way and execute hvloader.dll!p_HvlLaunchHypervisor.
Hvloader.dll!HvlLaunchHypervisor executes bootlib!BlGetExecutionEnvironment, bootlib!OslLoadMicrocodeUpdate and then jumps to hypervisor entry point (in subproc):

After mov cr3, rcx instruction we immediately see, that addresses after 0x3000 will be empty (page mapping).
Hvix64.exe is already in 64-bit address space. For reading memory from it we need to create debugger segment: Debugger option -> Manual memory regions.


Start address: FFFFFB0000000000
End Address: FFFFFCFFFFFFFFFF
You can set more extended range (f.e. 0-0xFFFFFFFFFFFFFFFE), if debugger doesn’t show warning messages. Launch PatchHvix64_2019.py script, when you on jmp rdx instruction.
If rdx in jmp rdx instruction points to address range outside manual memory regions, you get IDA PRO hang.
Close hvloader.dll database and open hvix64.exe database, attach it to VMware GDB stub. Launch RebaseHVGdb2019.py script, then RestoreHvix64_2019.py, which is return early replacing instruction
We are inside hvix64.exe


After vmlaunch we return back to hvloader.dll and next to winload.efi.

If you want debug OS loader simply don’t patch hvix64.exe and set breakpoint on instructions after vm_exit (mov eax, 1, for example).
Old ida-python scripts was modified for debugging simplifications.
1_PatchHvLoader2019.py
2_RestoreHvLoader2019.py
3_PatchHvix64_2019.py
4_RebaseHVGdb2019.py
5_RestoreHvix64_2019.py
Shortly, if you want debug hvix64.exe module using GDB, you need:
− start VMware in GDB debugging mode – you stopped on BIOS initialization block
− attach IDA PRO with winload.efi to GDB and make breakpoint to instruction, which make calling of hvloader!HvlLaunchHypervisor
− press F9
− run 1_PatchHvLoader2019.py through IDA.
− detach IDA PRO with winload.efi and attach IDA PRO with hvloader.dll
− run 2_RestoreHvLoader2019.py
− make breakpoint on instruction, that jump inside hypervisor (jmp r8)
− run 3_PatchHvix64_2019.py
− detach IDA PRO with hvloader.dll and attach IDA PRO with hvix64.exe
− run 4_RebaseHVGdb2019.py
− run 5_RestoreHvix64_2019.py
After that you can debug hvix64.exe from start+0x7A offset.
Need to mention, that hypervisor loading process in Windows Server 2012 (and higher) significantly differs from Windows Server 2008 R2, where preparation and launch of hypervisor directly produced by hvboot.sys, that run after Windows kernel loading. The activation of the hypervisor through instruction vmlaunch, performed in hvboot.sys and next VM exit was processed in the hvix64.exe.
4. Find symbolic information
Many of Hyper-V components have public symbols since 2018. At the time of publication only hvix64.exe, hvax64.exe and hvaa64.exe with hvloader.dll haven’t symbols. Latest hvloader.exe\efi and hvloader.dll symbols can be loaded for modules, compiled before 03.2018 (I used hvloader.dll symbols from Windows 10, build 17115, build date – 03.03.2018).
When loading hvix64.exe in IDA PRO we get about four thousand functions with names like sub_FFFFF8000XXXXX because Microsoft, unfortunately, does not provide the symbol information for the hypervisor. Facilitate the research of the hypervisor can first try to identify some of the functions without detailed study.
In the first place it is worth using bindiff (or diaphora) to compare the files hvix64, hvloader and winload where symbol information are provided. Comparison shows that the networking function (e1000), USB, cryptography and some other features are exactly the same as the ones that are present in winload.exe (in Windows Server 2019 and Windows 10 Hyper-V debugging and network driver’s functions have been moved to separate modules, f.e. bootlib.dll). This will help set the appointment of 500 functions. The same bindiff allows you to move the names of matching functions from one database to another idb. However, this method should be taken with caution and do not move all fully matched functions. At least the result should be analyzed by Visual comparison graph matching functions (Ctrl + E).
Next, let's define exception/interrupt functions, which are standard for processor architecture x86. A little script is written in python (ParseIDT.py) to parse the IDT, which must be run in IDA PRO, being connected through a debugging module of WinDBG to the hypervisor.
In the case of ISR was not found, check the tab List of problems in IDA PRO, since these procedures can not be found in the automatic analysis code that IDA performs.
Next, you can define the exit procedure in VM after reading field values VMCS. This can be done after the procedure fill the VMCS at hvix64.exe or use this script display-vmcs.py, which in the context of the hypervisor reads all fields VMCS and prints their values.
There is good ida-python scripts from Behrooz Abbassi (@rceninja): ia32_msr_decoder.py and IA32_VMX_Helper.py. You can apply it and get symbolic MSR and VMCS fields names inside IDA database.
Good news, that hypervisor symbols for hvix64.exe, hvax64.exe, hvboot.sys from Windows Server 2008 are presented. Bad news, that Windows Server 2008 is not updated and doesn’t have many of new Hyper-V features. But you can learn basic Hyper-V mechanism and hypercalls realization in comparing with Hyper-V TLFS 1.0.
Very good header file hvgdk.h, containing actual information about Hyper-V, was done by Alex Ionescu (@aionescu): https://ionescu007.github.io/hdk. It contains actual information on article publication time.
Also,
you can see information from Windows SDK WHVP API header files:
WinHvEmulation.h
WinHvPlatform.h
WinHvPlatformDefs.h
but now they contain description only for WinHvPlatform.dll and WinHvEmulation.dll libraries.
5. Tools
Many tools was developed during this years. I am not describing Sysinternals Suite, because it is standard for Windows researching without kernel or usermode debugging.
Interesting set of tools from Pavel Yosifovich (@zodiacon). It looks like Sysinternals Suite tools, but has source code).
ETWProvider – you can see all ETW providers, loaded by Hyper-V components in runtime.

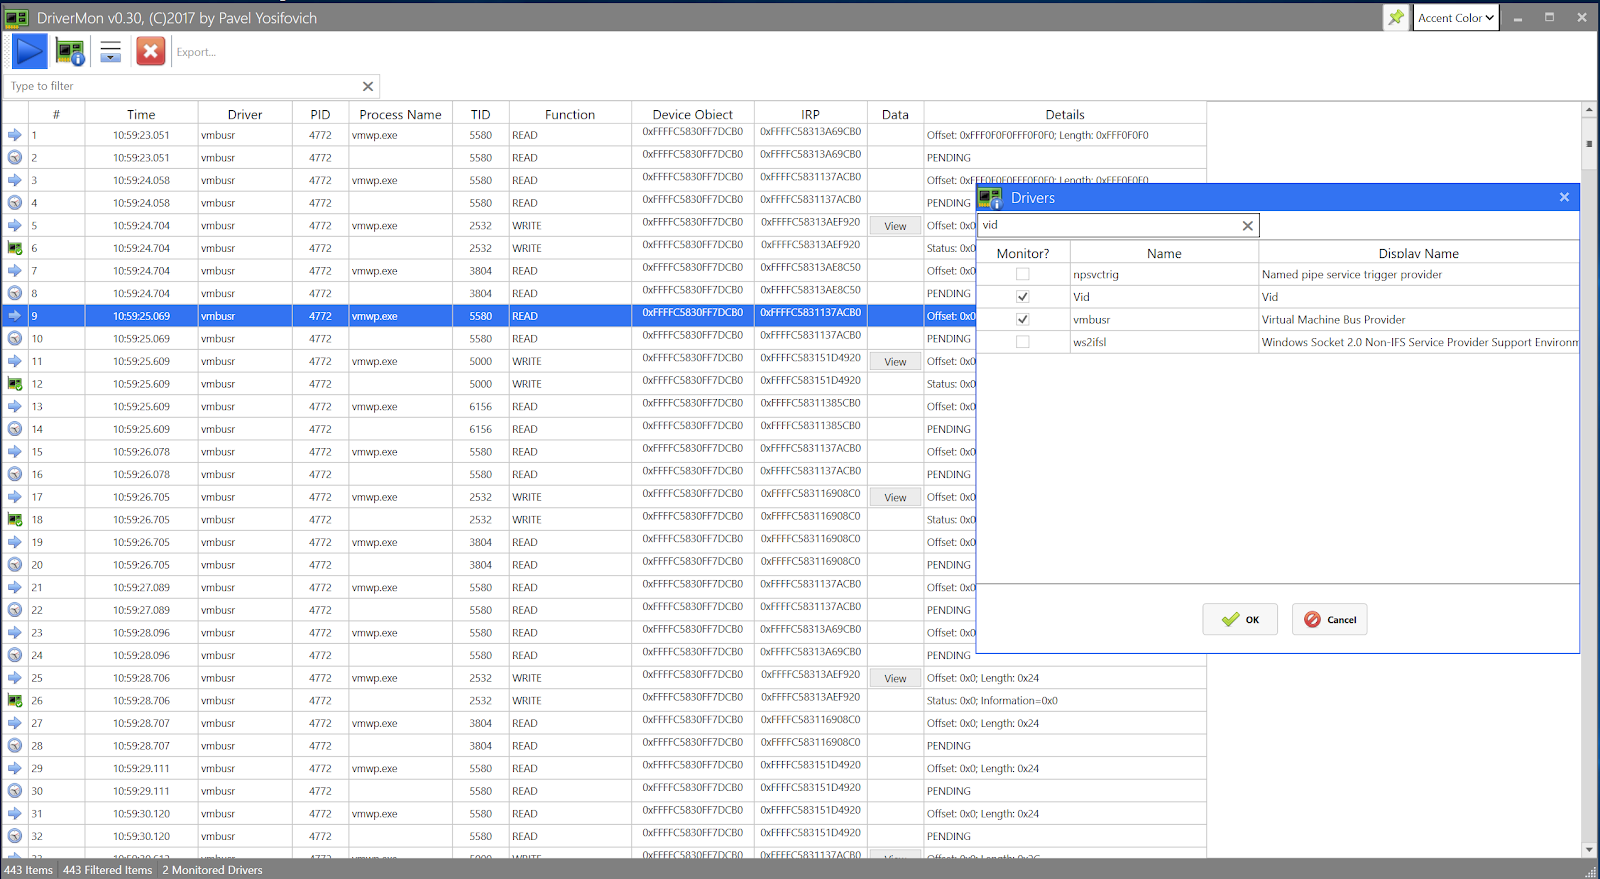
DrvMon – you can see communication between kernel mode and usermode Hyper-V components
Good collection of tools from Microsoft for diagnostic:
https://github.com/CSS-Windows/WindowsDiag
for Hyper-V can be used ETW collection tools:
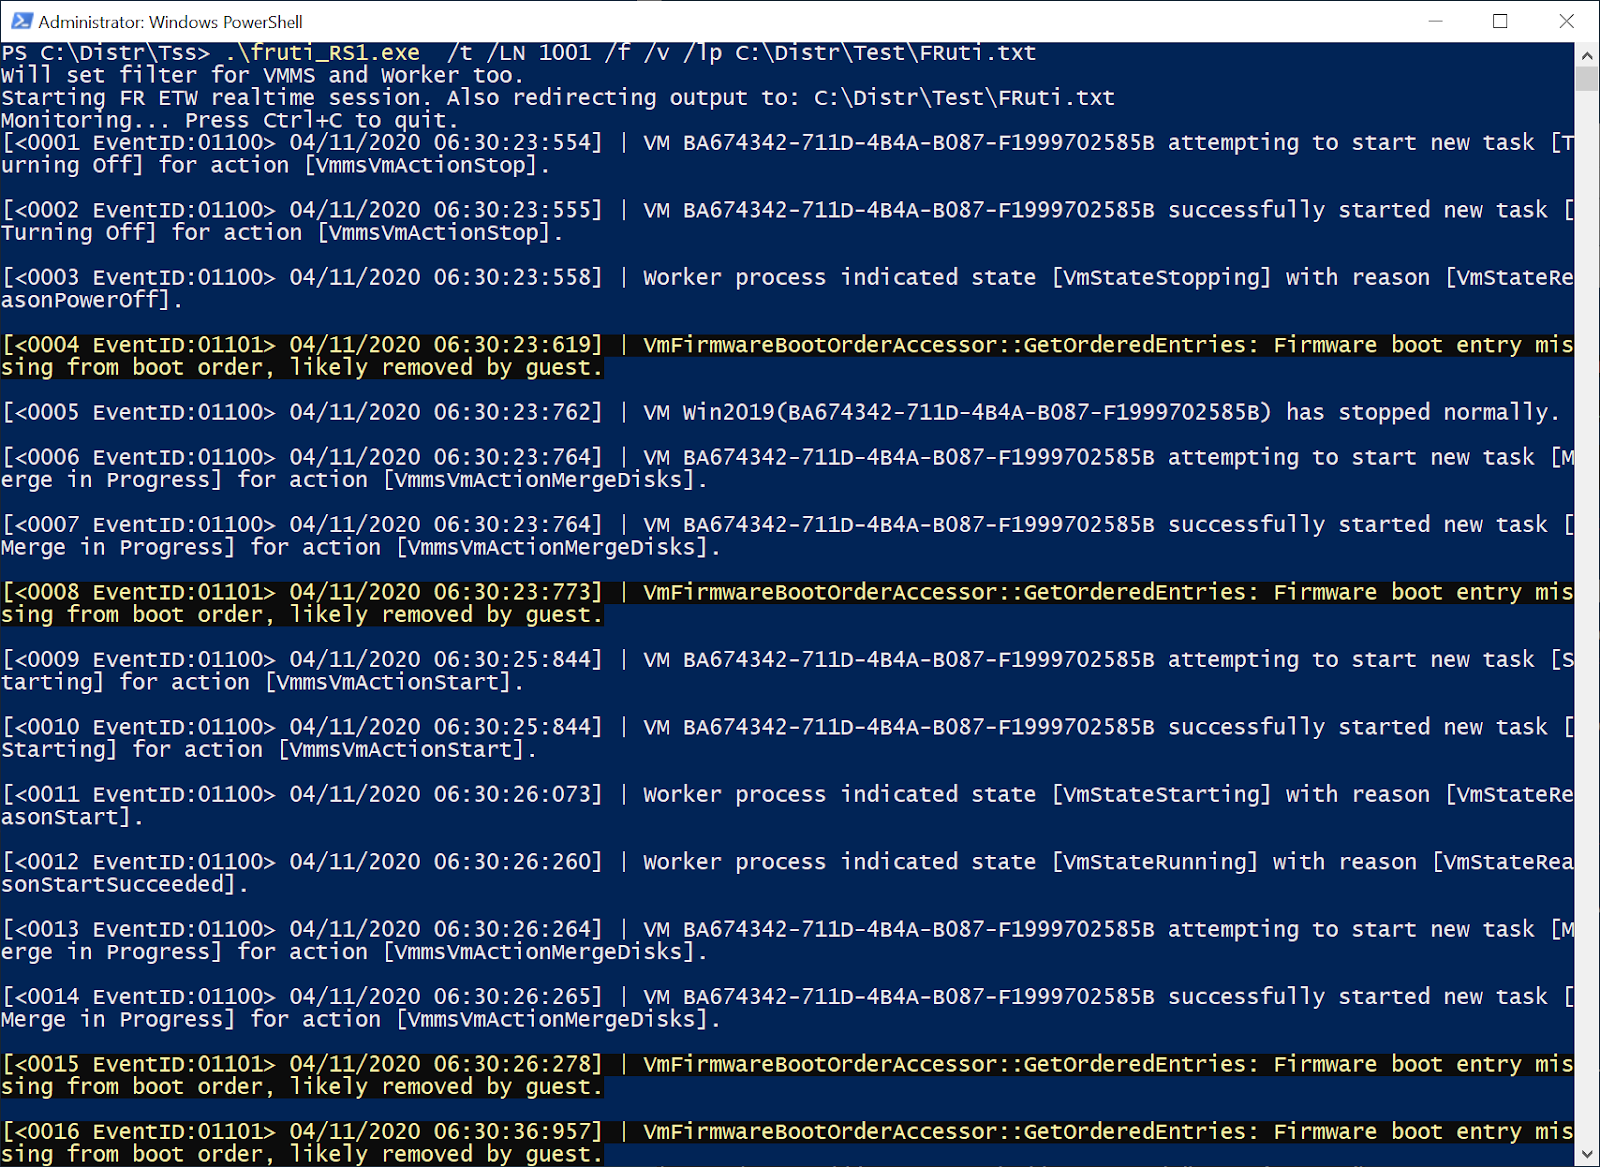
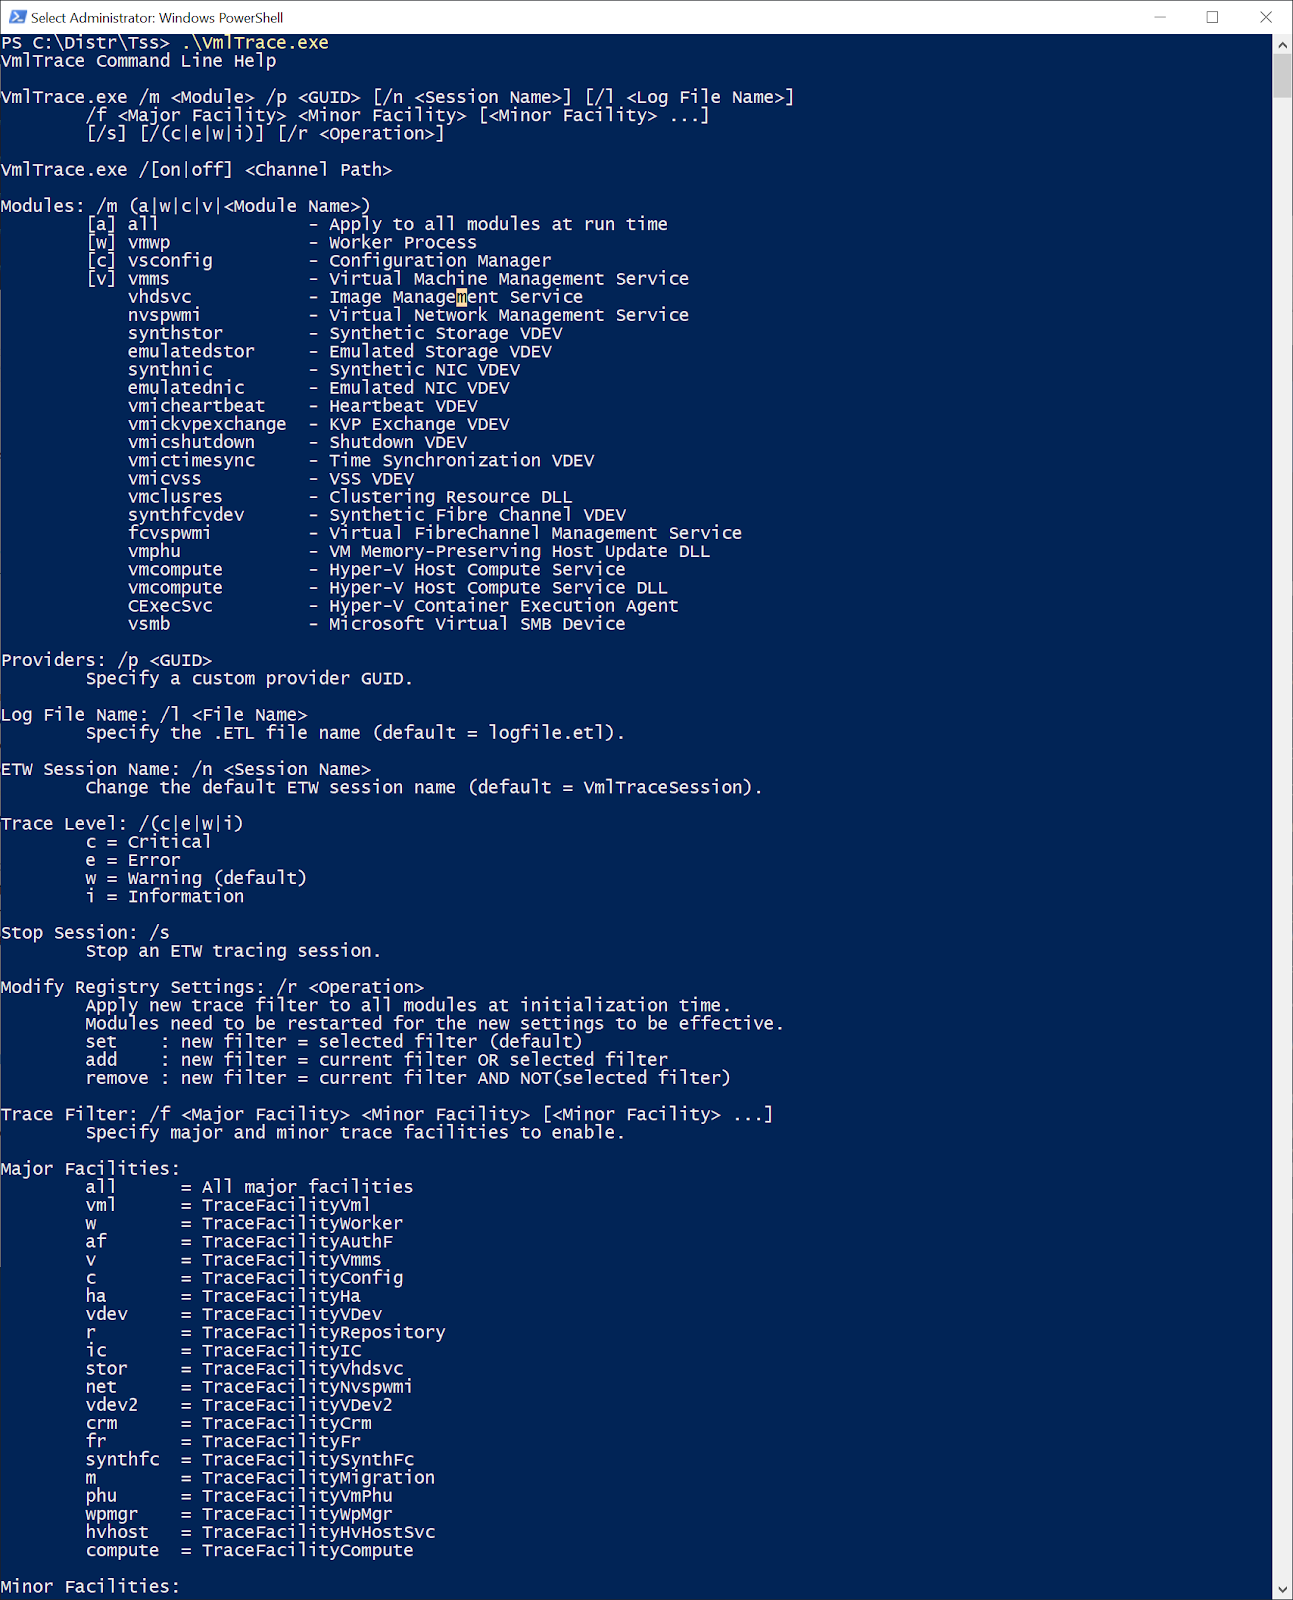
VMLtrace
Fruti
tss_VMLverbosity.ps1
V_Tracing_Using_Channels.ps1
6. Hypercalls
Latest Hypervisor Top-Level Functional Specification for Windows Server 2019 – 6.0b describes Hyper-V interfaces and internals information about part of Hyper-V components.
Each virtual machine and root OS is presented in terms of partition. Each partition has its own identifier, that must be unique on host server (64-bit size).
For each partition are given privileges to create (structure HV_PARTITION_PRIVILEGE_MASK), which determine the ability to perform specific hypercall.
Learn privileges by executing in the root-partition the following code in ring0:
WinHvGetPartitionId(&PartID);// partition id
WinHvGetPartitionProperty(PartID,HvPartitionPropertyPrivilegeFlags,&HvProp);// the result is returned in HvProp.
HvPartitionPropertyPrivilegeFlags – one of the enumeration values. HV_PARTITION_PROPERTY_CODE, which operate functions, exported driver winhvr.sys\winhv.sys.
HV_STATUS
WinHvGetPartitionProperty(
__in HV_PARTITION_ID PartitionId,
__in HV_PARTITION_PROPERTY_CODE PropertyCode,
__out PHV_PARTITION_PROPERTY PropertyValue
);
Also, if necessary, these privileges can be changed, causing root-partition in the following function:
HV_STATUS
WinHvSetPartitionProperty(
__in HV_PARTITION_ID PartitionId,
__in HV_PARTITION_PROPERTY_CODE PropertyCode,
__in HV_PARTITION_PROPERTY PropertyValue
);
The value of HvPartitionPropertyPrivilegeFlags for the Windows Server 2019 root partition: 002BB9FF00003FFF
The value of HvPartitionPropertyPrivilegeFlags for child partition 003B80B000002E7F:
In a Windows guest OS, privileges can be obtained by placing EAX 0x40000003 and following the instructions CPUID (Hyper-V TLFS 6.0b give interpretation of cpuid result).
CPUID 40000003 called
EAX =00002E7F (101110 01111111) - corresponds to bits 31-0 of HV_PARTITION_PRIVILEGE_MASK
EBX =003B8030 (111011 10000000 00110000) - corresponds to bits 63-32 of HV_PARTITION_PRIVILEGE_MASK
ECX =00000002 (10) - Reserved
EDX =00BED7B2 (10111110 11010111 10110010)
Bit 1: Guest debugging support is available
Bit 4: Support for passing hypercall input parameter block via XMM registers is available
Bit 5: Support for a virtual guest idle state is available
Bit 7: Support for querying NUMA distances is available
Bit 8: Support for determining timer frequencies is available
Bit 9: Support for injecting synthetic machine checks is available.
Bit 10: Support for guest crash MSRs is available
Bit 12: Support for NPIEP is available
Bit 14: ExtendedGvaRangesForFlushVirtualAddressListAvailable
Bit 15: Support for returning hypercall output via XMM registers is available
Bit 17: SintPollingModeAvailable
Bit 18: HypercallMsrLockAvailable
Bit 19: Use direct synthetic timers
Bit 20: Support for PAT register available for VSM
Bit 21: Support for bndcfgs register available for VSM
Bit 23: Support for synthetic time unhalted timer available
The hypervisor privileges section, which carried out the operation, that caused the VM exit, can be obtained by calculating the value of gs: 0, read the value of the field in the VMCS HOST_GS_BASE or IA32_GS_BASE MSR:
WINDBG>rdmsr 0xc0000101
msr[c0000101] = fffffbdb`a68c2000
then get the value pointed to gs:83a8, and go to the offset 0xd8.
WINDBG>dc poi(fffffbdb`a68c2000+0x83a8)+d8
ffffe800`000010d8 00003fff 002bb9ff 00000000 ffffe800 .?....+.........
ffffe800`000010e8 00000000 00000000 00216560 ffffe800 ........`e!.....
ffffe800`000010f8 00000001 00000000 00000000 00000000 ................
ffffe800`00001108 002342c0 ffffe800 00000000 00000000 .B#.............
In this case, the VM exit was made from root-partition.
The hypervisor in each section forms a special page to run hypercall. Its address can be obtained by reading MSR 0x40000001 (HV_X64_MSR_HYPERCALL):


In order to be able to use the export function winhv.sys\winhvr.sys can either dynamically calculate the addresses of the functions, or to create a lib-file. Consider the second option.
To create a def-file using the output of dumpbin:
dumpbin /exports winhv.sys
(Windows Server 2016 and newer uses a winhvr.sys driver in root partition, so the def-file for the driver in the OS is necessary to form it).
To build a 64-bit driver you do not need to make any changes.
After editing the def-file it must be re-form the lib-file with the command (for x86):
lib.exe /def:winhv.def /OUT:winhv.lib /machine:x86
For x64:
lib.exe /def:winhvr.def /OUT:winhvr.lib /machine:x64
Run Visual studio native tools command prompt before execute this.
We can find hypercall table in hvix64.exe using script
https://github.com/gerhart01/Hyper-V-scripts/blob/master/CreatemVmcallHandlersTable2019.py
Script creates table like that:

We can display VMCS fields inside hvix64.exe, using script.
https://github.com/gerhart01/Hyper-V-scripts/blob/master/display-vmcs.py
Attach script to hvix64.exe IDA PRO database. It calls procedure
vmread rax, rax
jmp -3
inside hvix64.exe, read rax value and display it in console.
For comparison, some of the important fields VMCS were obtained using the script display_vmcs.py after VM exit:

For instance, you can see, that for guest-partition the hypervisor handles all input/output (I/O exiting Unconditional), and for the root partition monitors only certain ports (Use I/O bitmaps).
WINDBG>!db 0x101001000 L1300
#101001000 00 00 00 00 03 00 00 00-00 00 00 00 10 00 00 00 ................
#101001010 00 00 00 00 03 00 00 00-00 00 00 00 00 00 00 00 ................
……………………………………………………
#101001080 00 00 00 00 00 00 00 00-20 00 00 00 00 00 00 00 ........ .......
………………………………………………………
#101001190 00 00 00 00 00 00 00 00-00 00 00 00 00 00 00 f1 ................
Also you can modified existing Linux integration tools for deep debugging of vmbus:
7. Conclusion
The article describes steps, that must be done to create a stand for the Hyper-V research, and briefly describes some aspects of the hypervisor working. I hope, this information will be useful for beginners researcher of security of Microsoft’s hypervisor. Links on tools or open sources utilities I collected on github.com:
https://github.com/gerhart01/Hyper-V-Internals/blob/master/HyperResearchesHistory.md
Hyper-V internals researches (partition – “Hyper-V related open source utilities, scripts”)
Scripts, mentioned in article, placed on github:
https://github.com/gerhart01/Hyper-V-scripts
Scripts, testing on IDA PRO 7.5, loaded in ida75 subfolder.
Radare2 build for Hyper-V debugging placed:
https://yadi.sk/d/eDAD9gIMEcAYEg
Hyper-V guest driver source:
https://github.com/gerhart01/Hyper-V-Internals/tree/master/hyperv2019